
Flip 與 Crash and Boom indices 比較解析
了解 Crash Boom Flip indices 與 Deriv 上的 Crash and Boom 有何不同。掌握跳動頻率、方向規則及風險管理策略。
Deriv 編輯團隊 · 2026年8月20日 · 4 分鐘閱讀

如果您已經交易過標準的 Crash 或 Boom indices,那麼 Crash Boom Flip (Flip) indices 對您來說會非常熟悉。兩者都採用相同的跳動點結構,出現在相同的 Deriv 平台上,並使用相同的交易機制。主要差異在於市場方向的行為表現。
Crash and Boom indices 如何移動
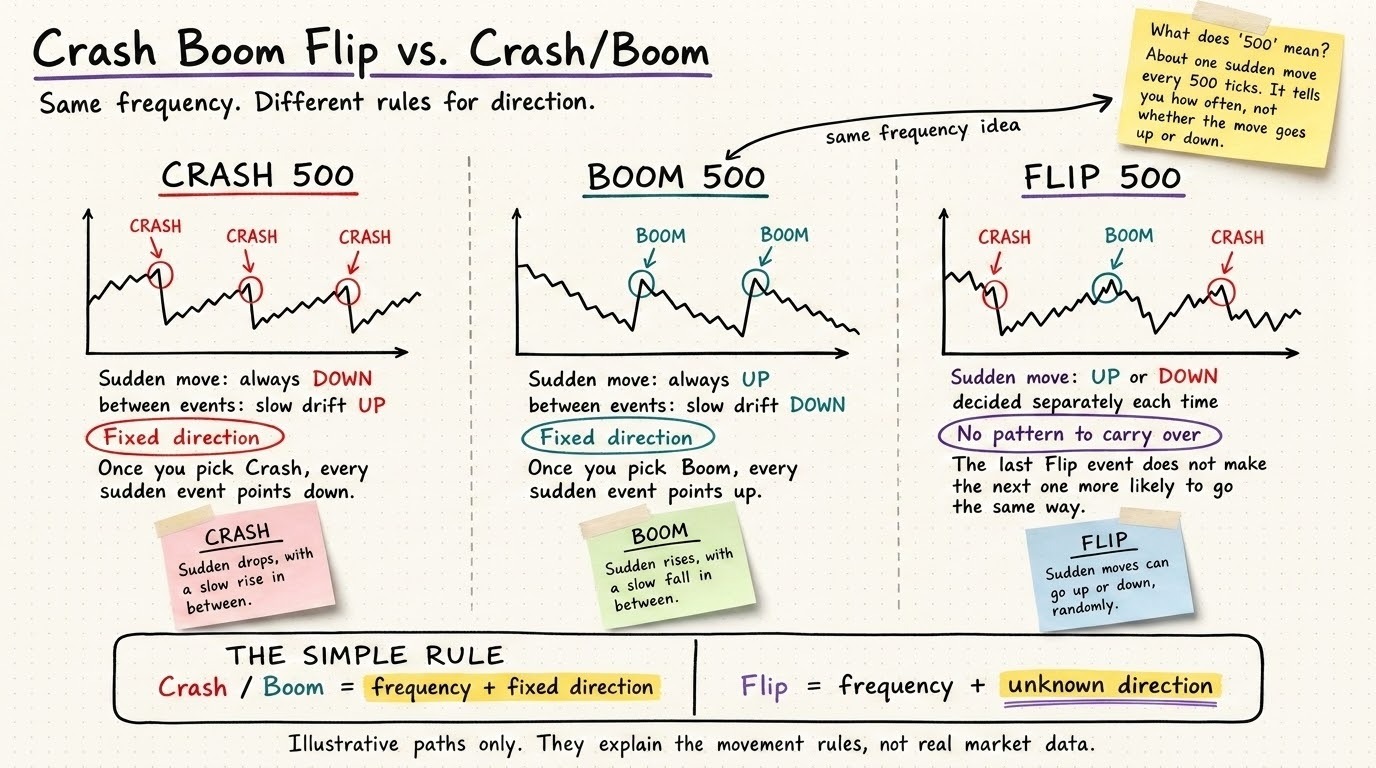
Crash index 會突然下跌,然後緩慢攀升,直到下一次下跌。Boom index 則會突然跳升,然後緩慢回落,直到下一次跳升。對於這兩種指數,突發價格走勢的方向都是固定的:Crash indices 始終向下跳動,而 Boom indices 始終向上跳動。指數名稱中的數字代表這些突發走勢發生的頻率。
例如,Crash 500 Index 平均每 500 個跳動點出現一次下跌,而 Crash 1000 Index 則平均每 1,000 個跳動點出現一次下跌。一個跳動點代表一次單一的價格更新。數字越小,突發走勢發生得越頻繁;數字越大,走勢之間的間隔越長。該數字表示事件頻率,而非方向。
Flip 帶來了什麼改變
與標準的 Crash 或 Boom indices 不同,Flip index 沒有固定的方向。
每一次突發走勢都可能隨機是崩盤或暴漲,每次都是獨立產生的。過去的價格走勢不會影響未來的走勢,這意味著不存在可預測的方向性模式。
編號系統的運作方式相同:Flip 500 Index 與 Crash 500 或 Boom 500 Index 具有相同的事件頻率。然而,雖然數字告訴您走勢發生的頻率,但不再指示方向。標準指數同時定義了頻率和方向,而 Flip indices 僅定義頻率。
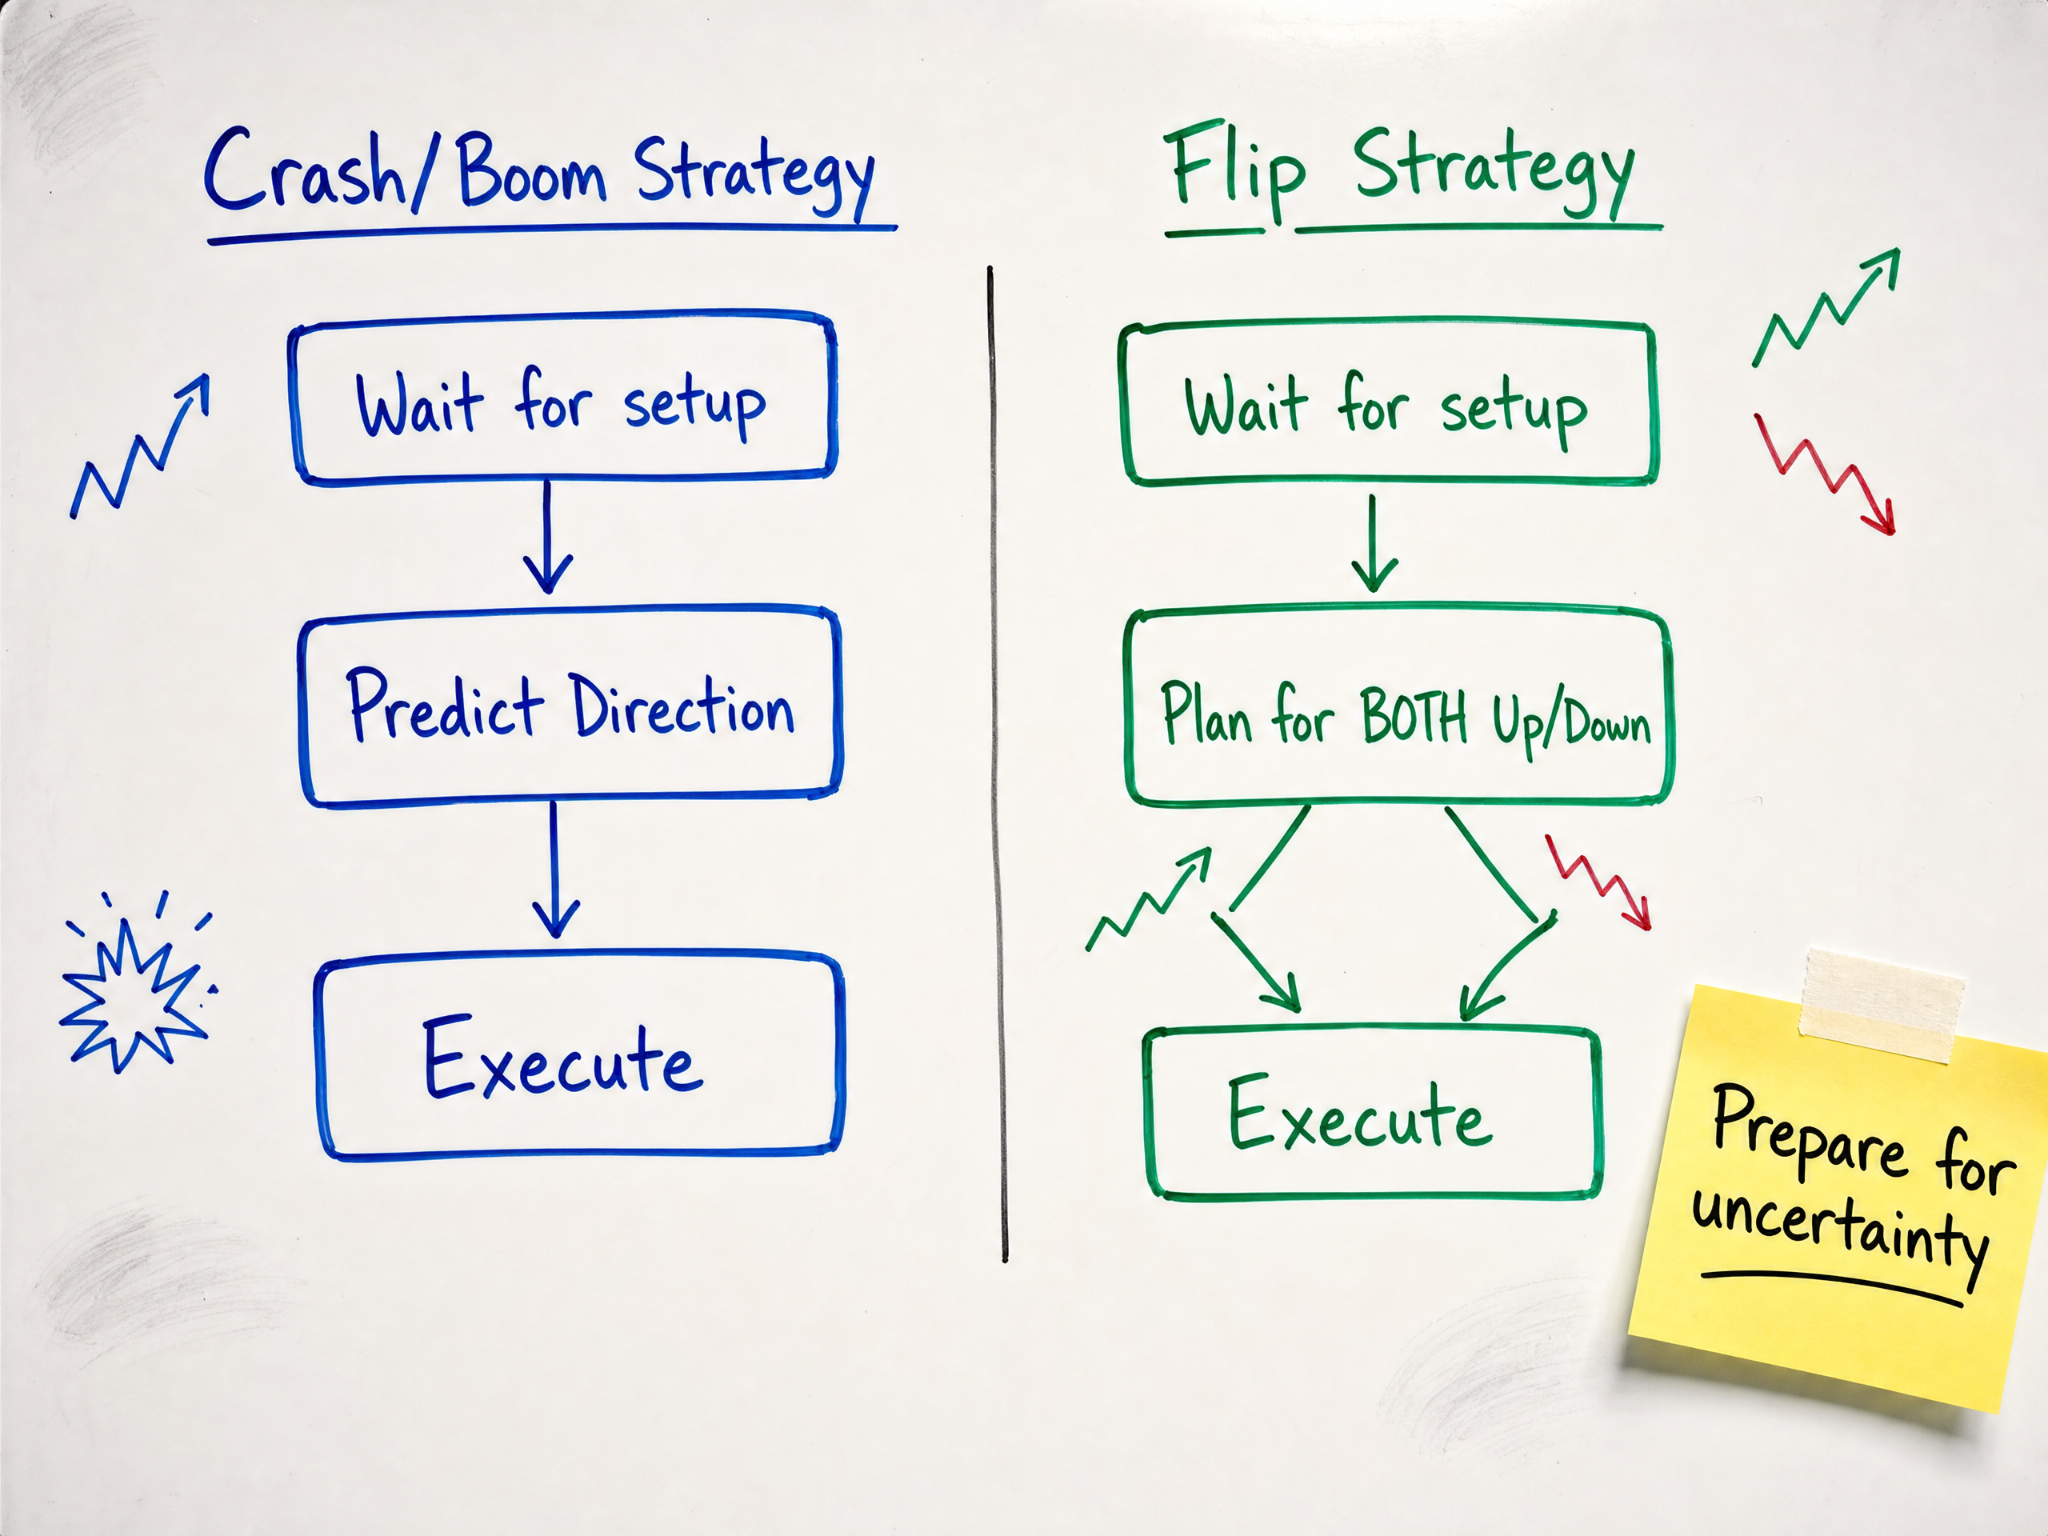
由於價格方向是隨機的,依賴標準 Crash 或 Boom indices 固定方向的策略不適用於 Flip indices。交易者必須在每筆交易中調整其風險管理,以應對不可預測的價格走勢。
快速對照
| 指數 | 突發走勢 | 事件之間 |
| Crash | 向下 | 緩慢上移 |
| Boom | 向上 | 緩慢下移 |
| Crash Boom Flip | 隨機向上或向下 | 方向不可預測 |
如何在兩者之間做選擇
- 選擇 Crash 或 Boom indices,如果您偏好以固定且已知的方向進行交易,並圍繞突發跳升或下跌維持一致的走勢模式。
- 選擇 Flip indices,如果您偏好雙向市場走勢交易,價格跳升可隨時發生於任一方向。
- 同時交易兩者以分散策略。這些指數獨立運作,因此標準 Crash 或 Boom indices 的市場活動不會影響 Flip indices。
親自比較看看
了解這些指數差異的最佳方式是在價格圖表上即時觀察它們。您可以開設免費的 Deriv 模擬帳戶,將 Crash、Boom 及 Flip indices 並排畫圖,練習交易策略。
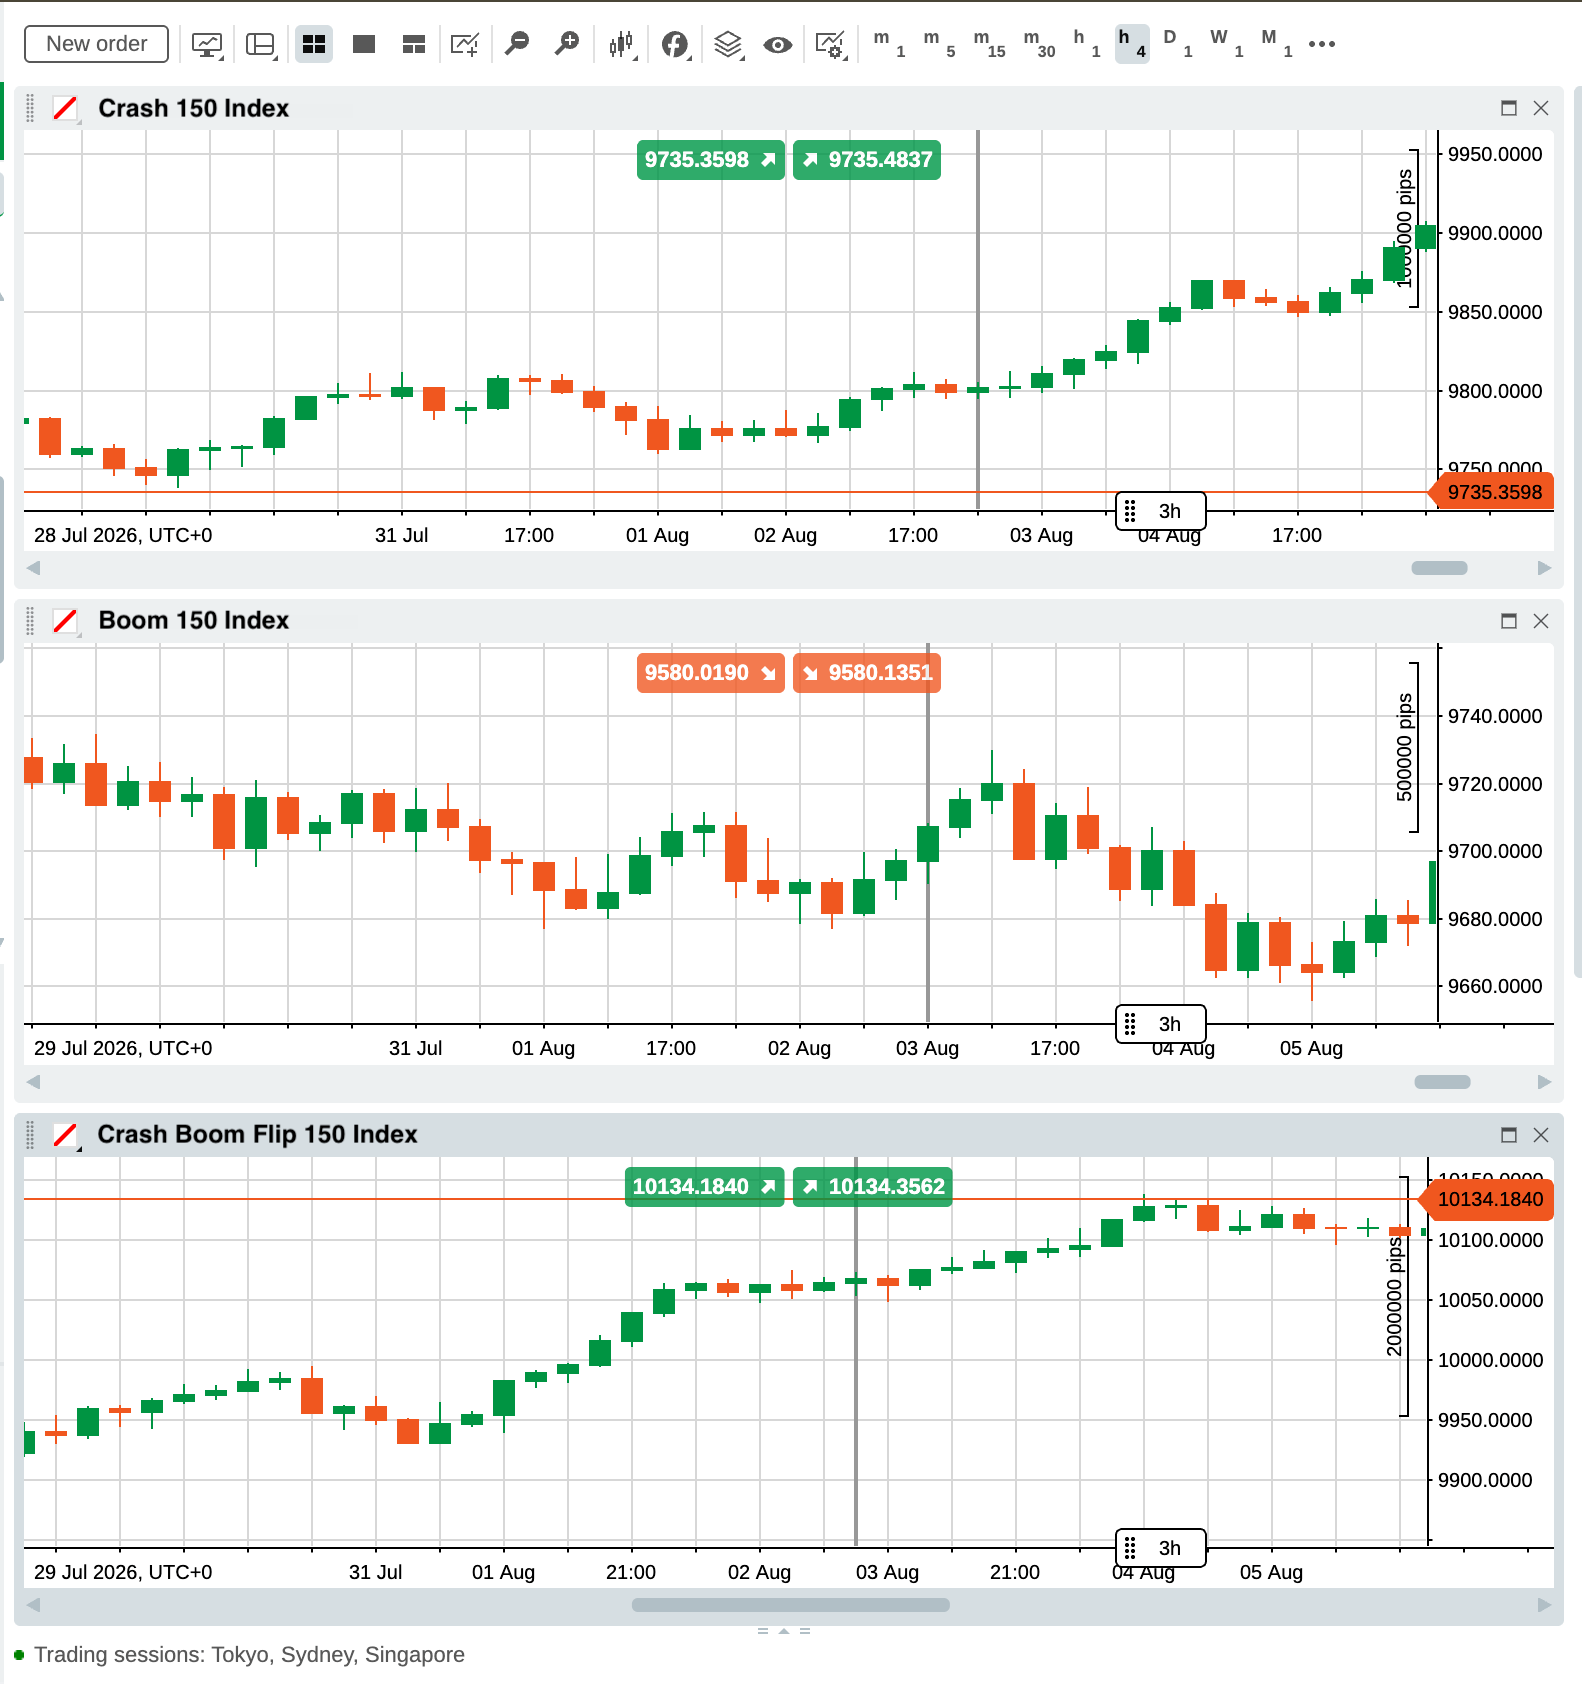
觀察每張圖表幾分鐘。您會發現 Crash 和 Boom indices 遵循一致的循環(例如:下跌、緩慢上升、下跌)。相比之下,Flip index 的走勢不可預測,這正是其定義特徵。
技術指標能預測 Flip indices 上的跳動方向嗎?
不能。Flip index 上的每一次跳動都是獨立產生的,過去的走勢不會影響未來的走勢。這意味著沒有任何指標能告訴您下一次跳動將是崩盤還是暴漲。指標仍然可以幫助判斷時機、波動性和風險大小,但無法判斷方向。對於標準 Crash 或 Boom indices,方向是事先固定的,因此解讀方式不同:您已經知道跳動的方向。
哪個時間週期適合捕捉跳動?
一分鐘時間週期最適合捕捉跳動,因為它能即時顯示跳動的發生並讓您快速反應。代價是更多的雜訊和更快的決策節奏。在 Crash 和 Boom indices 上,您可以圍繞跳動的固定方向進行規劃。但在 Flip indices 上則無法如此,因此請為任一方向的走勢做好準備,並在跳動發生前而非發生後設定風險。在模擬帳戶上測試幾個較短的時間週期,保留最符合您反應速度的那一個。
在哪裡可以交易這些指數?
Crash、Boom 及 Flip indices 是 Deriv 的專屬合成指數,因此可在 Deriv 平台上 24/7 進行交易。您可以如上方圖表所示在 Deriv cTrader 上存取它們,也可以在 Deriv MT5 上使用。開啟平台後,依名稱搜尋指數,例如 Crash 500 或 Flip 150,然後將其加入您的觀察清單以進行即時圖表分析。
| 交易涉及重大風險。您可能會損失部分或全部的投入資金。 |