
Gold below $4,000: The bounce failed. What comes next?
Gold fell to around $3,880 as metals and stocks sold off, even as yields eased. The levels that would strengthen or weaken the breakdown.

By Prakash Bhudia · Global Trading Strategist & Technical Markets Expert
2 November 2026 · 5 min read

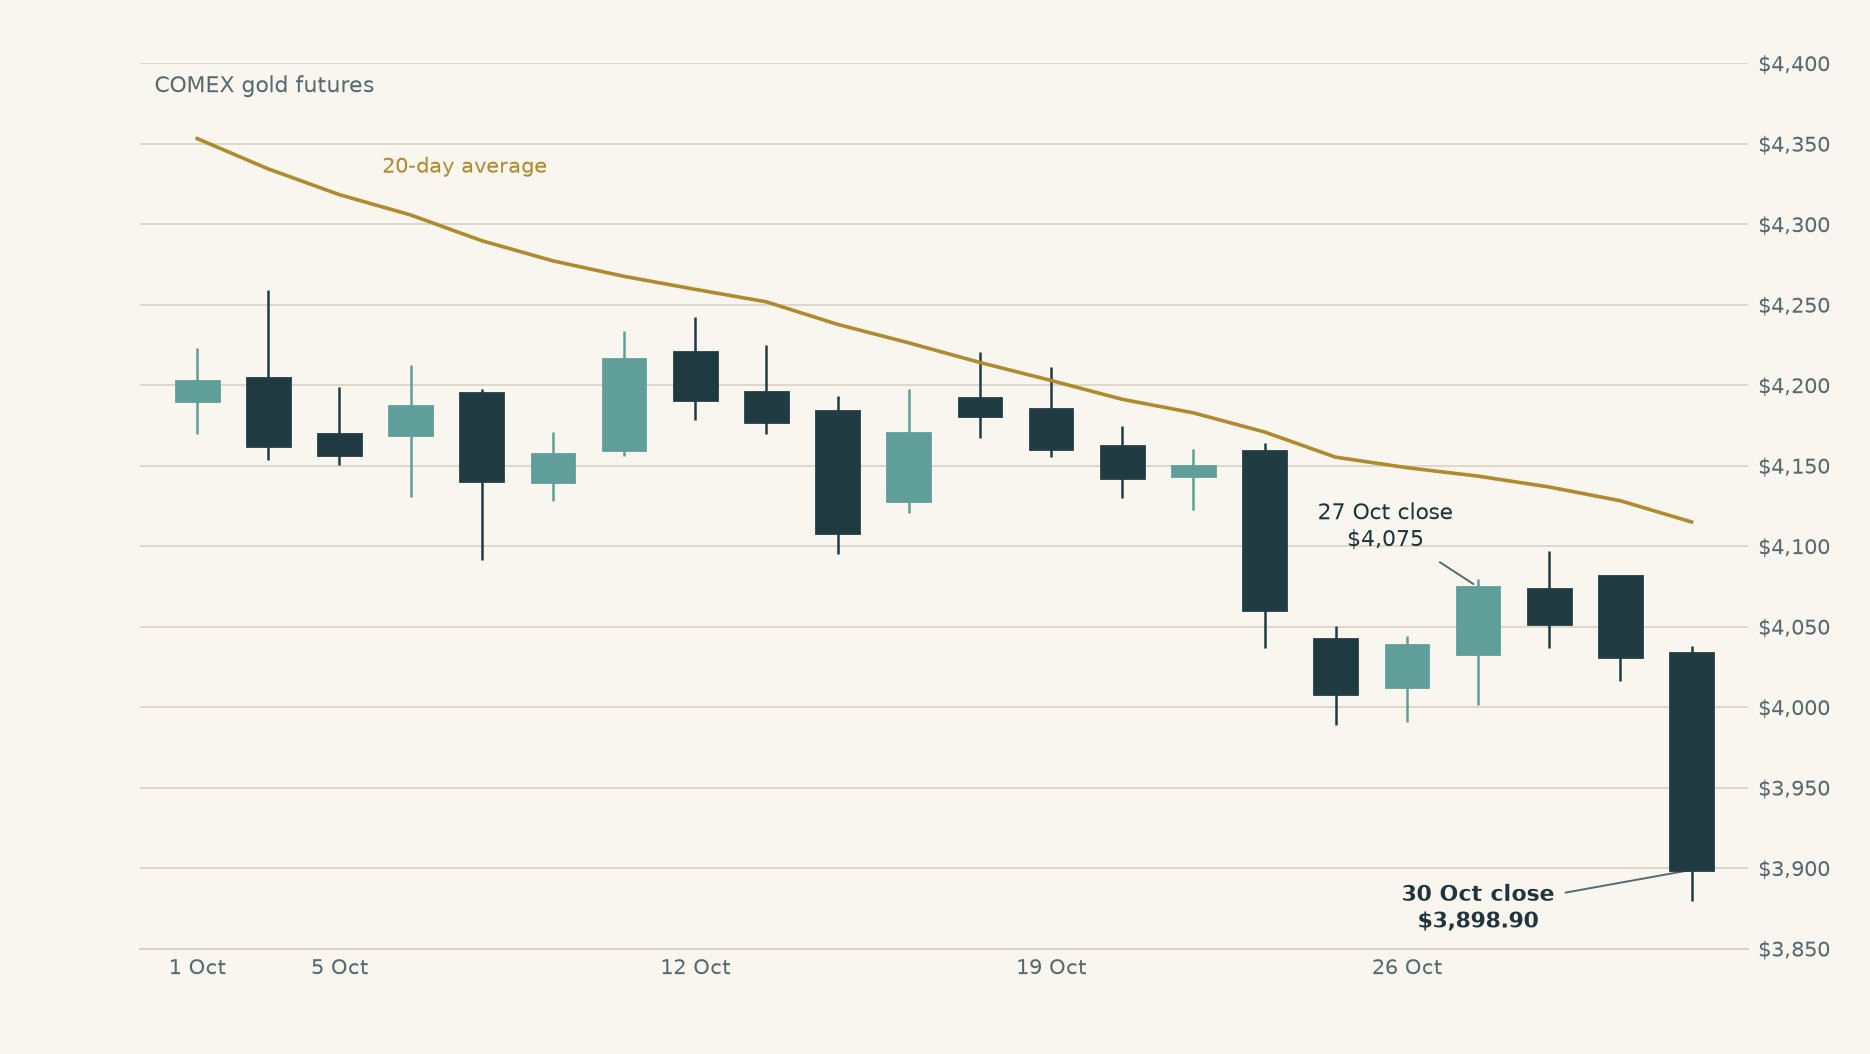
The bounce did not hold. In the previous note, $3,976–$4,000 was the floor to watch. Gold recovered above it, then fell sharply on Friday, with spot quoted around $3,880 late in US trading. The downside scenario has developed. The next question is whether the old floor becomes a ceiling.
The fall was broader than gold: metals and stocks sold off even as the dollar and Treasury yields eased. Persistent inflation helps explain gold’s difficult backdrop. It does not, by itself, explain Friday’s selling.
Inflation left gold vulnerable. The selling spread wider.
The Fed held its policy rate at 3.75–4.00% on Wednesday, but two members wanted a quarter-point increase. Thursday’s inflation release showed consumer prices rising 3.6% over the year on the Fed’s preferred PCE measure, or 3.1% excluding food and energy.
That is an uncomfortable backdrop for a non-interest-paying asset. Higher oil prices can keep inflation elevated and make it harder for the Fed to lower rates. Oil rose another 2.1% on Friday. But the Fed did not hike, and market yields fell that day: the ten-year Treasury yield dropped from 4.98% to 4.94%, while its inflation-adjusted counterpart fell from 2.63% to 2.60%.
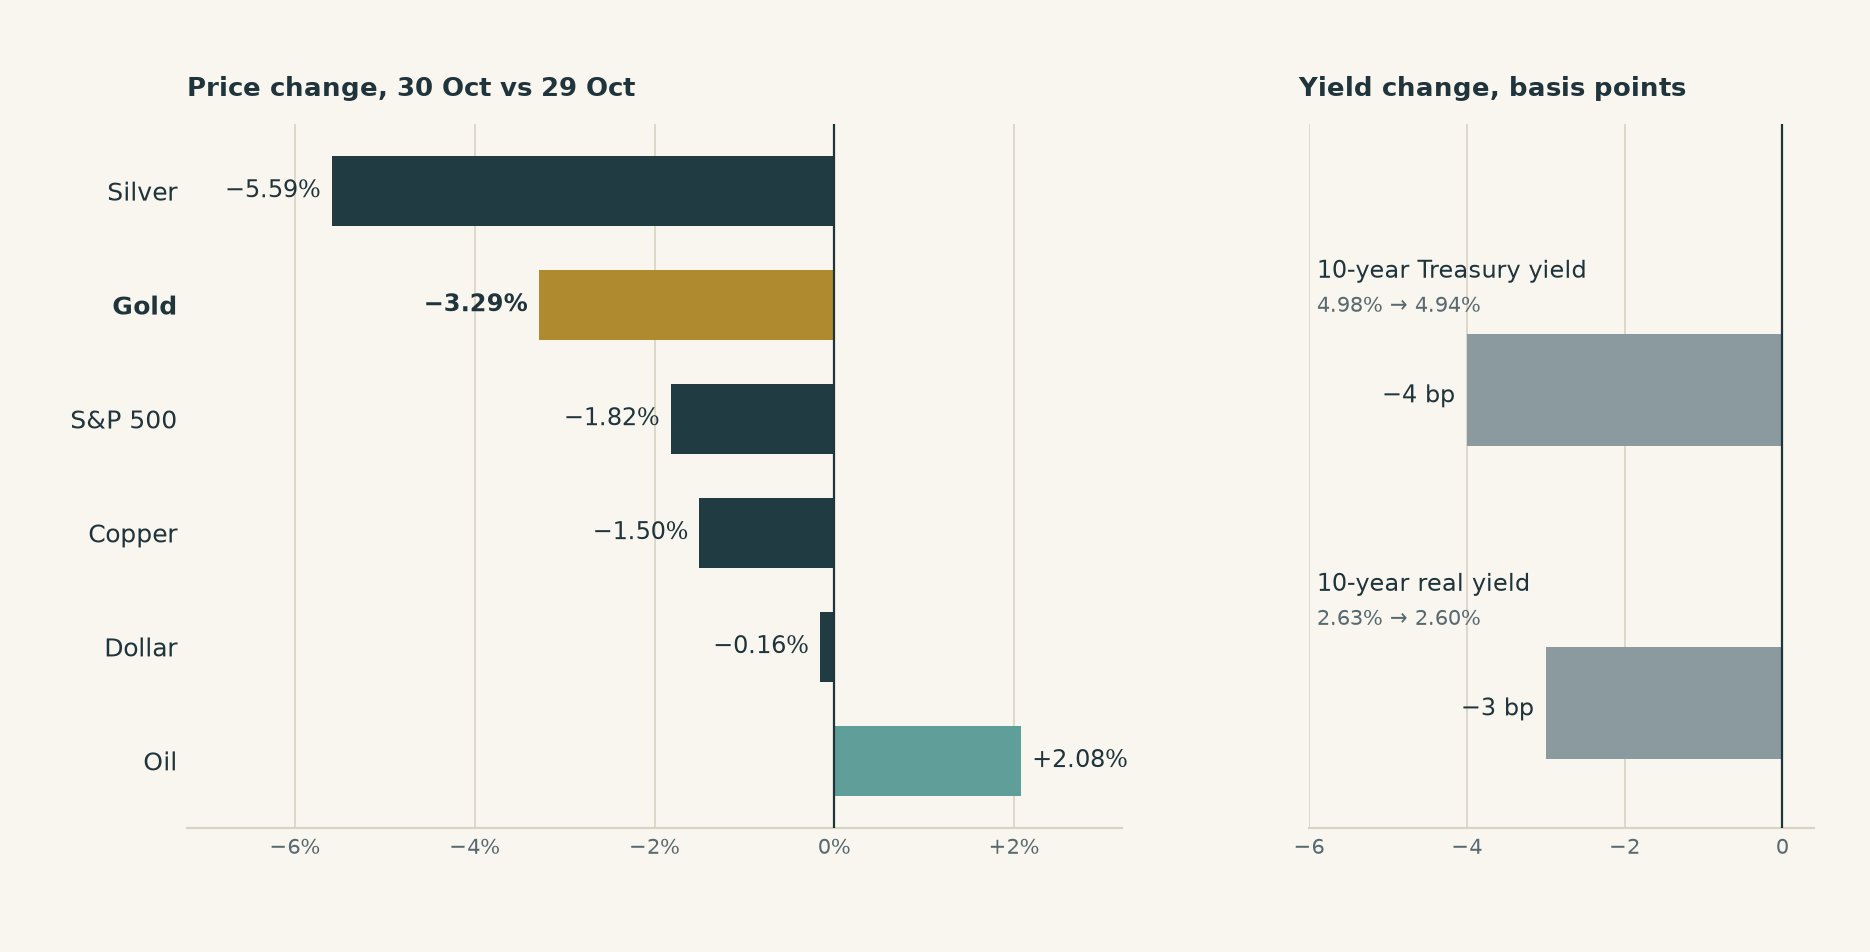
In the dollar-and-real-yield framework used earlier in this series, both moved in a direction usually considered helpful to gold. Gold fell anyway. Silver lost 5.6%, copper 1.5% and the S&P 500 1.8%. A broad reduction in risk is a better description of Friday than a fresh dollar-and-rates shock. It is not proof of forced liquidation or of one particular seller.
The latest fund data do not settle that question. GLD’s holdings were almost unchanged from 23 to 29 October, down just 0.57 tonnes. Futures money managers added 1,356 net-long contracts in the week to Tuesday, 27 October. Neither observation captures Friday’s selling. The evidence supports a widespread sell-off; it does not identify who caused it.
The old floor is now the recovery test
Gold has passed below both $4,000 and the $3,939 reference in the previous note. That changes their role: they are now levels a recovery must get back through. A retest means returning to a broken level to see whether buyers can reclaim it or sellers turn the rally back.
| Spot-gold area | What would change the picture |
|---|---|
| $3,850– $3,860 | The area around the previous $3,856 historical reference. Holding here would slow the decline. Sustained trading below it would leave $3,800, a round- number reference, next in view—not an established floor. |
| $3,939 | The first recovery reference. Regaining it would recover some lost ground, but would still leave gold below the old floor. |
| $3,976– $4,000 | The central test. A recovery above this area that survives a pullback would weaken the breakdown. A rally rejected here would strengthen it. |
| $4,055– $4,060 | The earlier recovery reference and the vicinity of the 27 October spot observation. Getting above it would reverse more of the latest downswing. |
A breakdown still needs follow-through
The earlier gold breakout study found the price lower ten trading days after a downside 20-day break in 44% of cases, against 47% after an ordinary day. That tested closes below previous 20-day lows, not this particular $4,000 level. The lesson is to look for continued selling rather than assume every break carries itself lower.
The next major scheduled US release is the jobs report on Friday, 6 November. Watch gold’s response alongside the dollar and real yields. If yields ease again and gold still cannot recover, lower rates alone are not enough to bring buyers back. A sustained reclaim of $4,000 would be more persuasive evidence of recovery than a brief bounce after a large fall.
The weak trend has now broken the old floor. A rally that fails below $4,000 would leave sellers in control; a reclaim that holds would challenge that reading. Below $3,850– $3,860, the next question becomes whether buyers appear around $3,800.
Sources, dates and calculation notes
Price cut-off: Friday, 30 October 2026. The spot quote around $3,880 is from Kitco’s late- US-session report, not an official spot closing price. The main chart uses Yahoo’s COMEX gold futures series; no spot and futures observations are spliced together. Daily percentage moves are close-to-close. Cross-market co-movement describes the sell-off; it does not establish its cause.
Yields: US Treasury nominal and real ten-year par yields. Friday changes: −4 and −3 basis points respectively. The real yield is the yield on inflation-protected Treasuries.
Holdings and positioning: SPDR Gold Shares archive: 1,041.65 tonnes on 23 October and 1,041.08 on 29 October, the latest available observation at retrieval. CFTC disaggregated futures-only report: managed-money net longs rose from 104,206 to 105,562 contracts between 20 and 27 October. Net long means long contracts minus short contracts. Tuesday positions cannot establish Friday activity.
Levels: $3,939 and $3,856 retain the historical spot references from the previous note; they are observations, not guaranteed support. $4,055 is its earlier recovery reference, and the local Deriv XAUUSD observation on 27 October was $4,060.95. $3,800 is a round number, not a backtested target. Historical spot references and futures chart prices are labelled separately.
Historical comparison: the existing 2011–15 October 2026 study used 198 downward breakout signals and 4,083 eligible ordinary dates, with ten future trading days available. These are price outcomes, not trade win rates; observation windows can overlap. This follow-up does not add a new trading backtest.
Public source snapshots and calculations were saved on 1 November 2026. The prior market note remains unchanged.
This content is not intended for EU residents. The performance figures quoted refer to the past, and past performance is not a guarantee of future performance or a reliable guide to future performance.