
The indicators that don't work on Derived indices
No volume, no sessions, no gapsDerived Indices break most indicators. Here's which ones still work on Volatility indices, and which are just noise.

Por Aleksandrs Popovs (Sasha) · Dealing Products Team Lead
24 de septiembre de 2026 · 6 min de lectura
Last Thursday a embedded TradingView's Technical Analysis widget on a test page, pointed it at the Volatility A0 (As) andex, and got a cloud with a sad face and the words "No data here yet." I checked the obvious things first. The symbol page for DERIV:VOLATILITY_10_1S_INDEX loads fine on tradingview.com. The widget's frame rendered, so it wasn't my ad blocker. I tried other Derived indices. Same cloud. The gauge that summarises a dozen indicators into a needle pointing at "buy" or "sell" simply doesn't compute for Deriv's synthetic instruments.
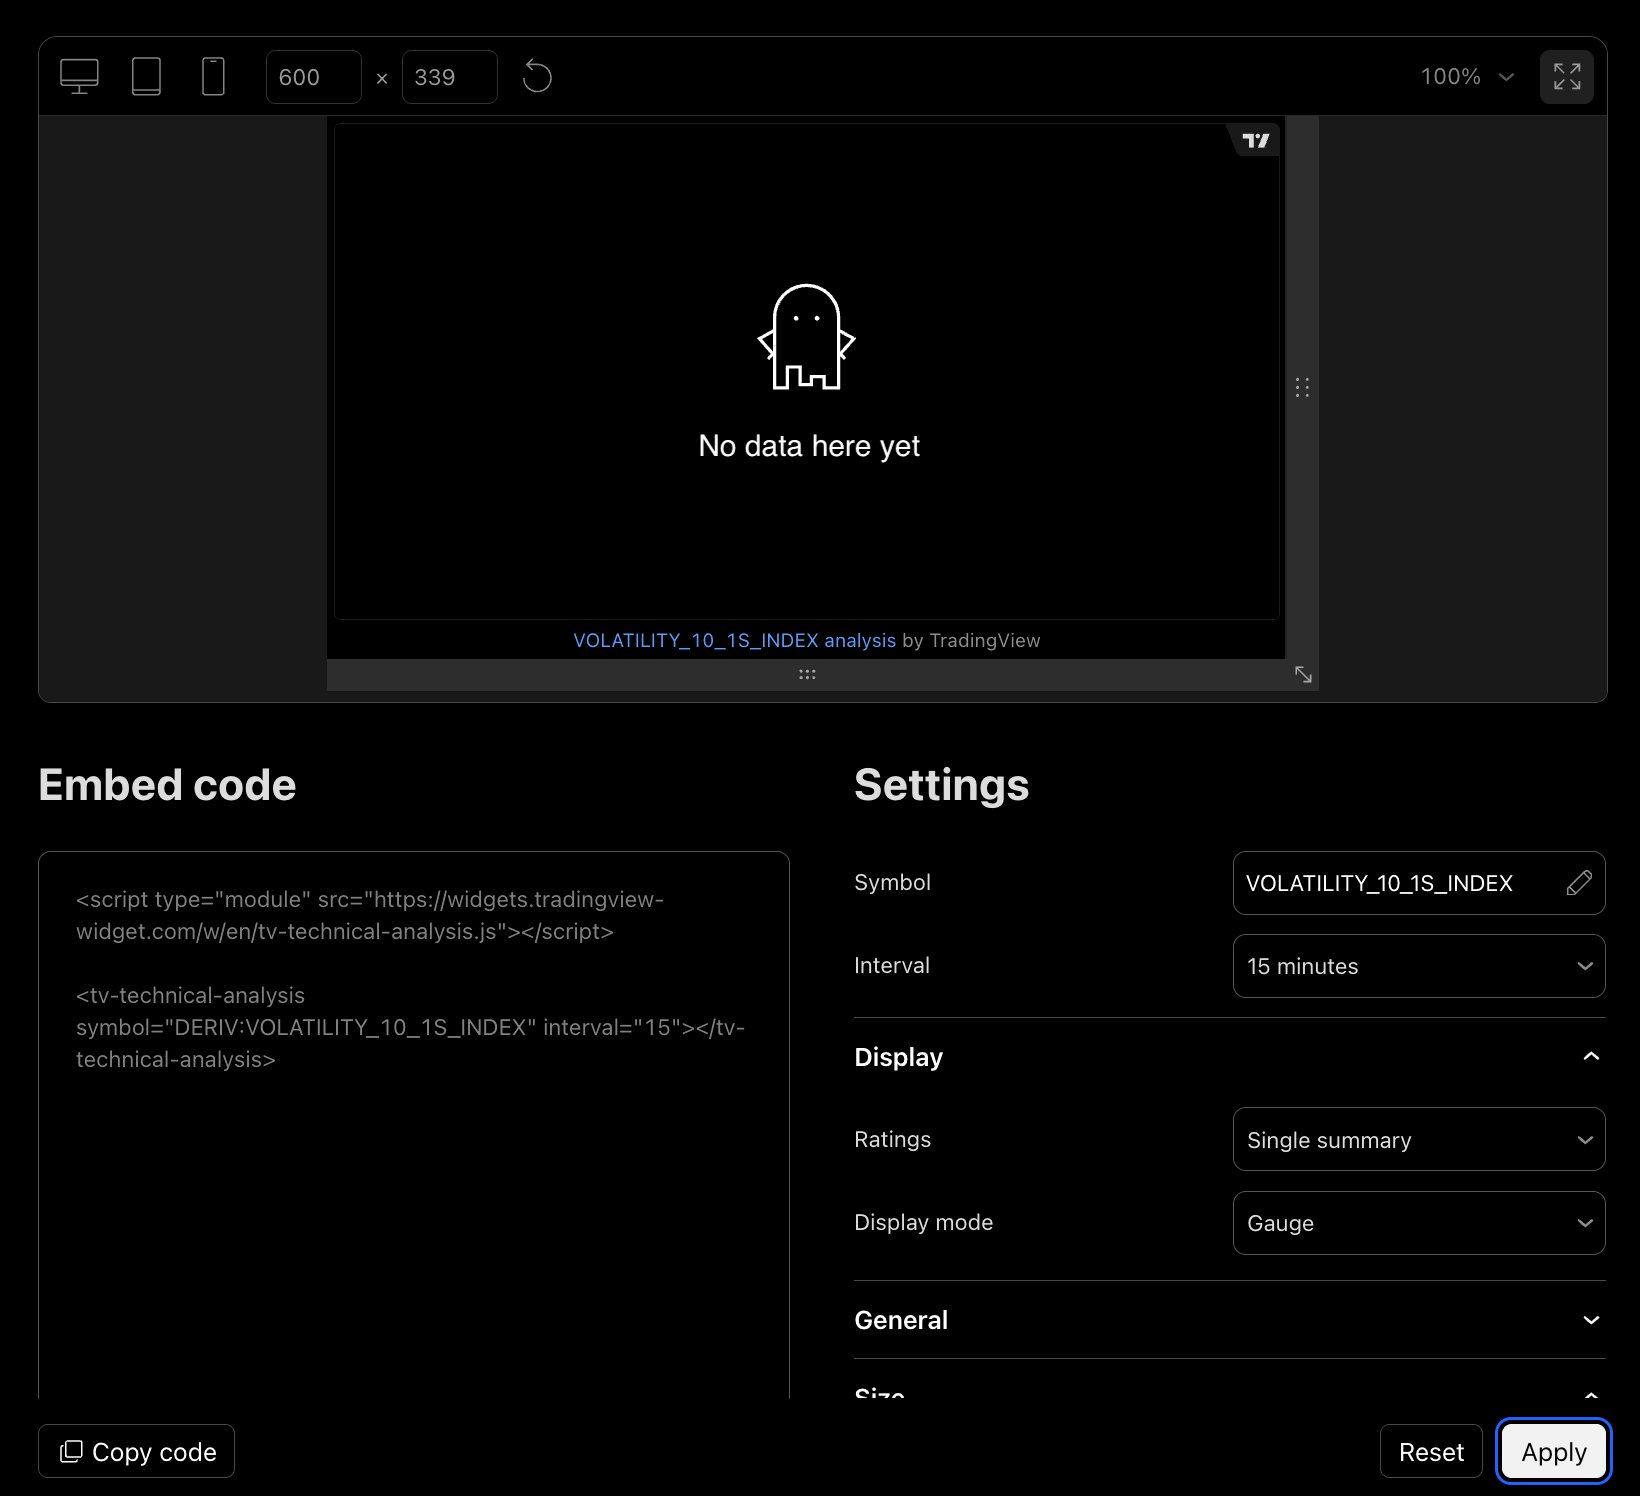
My first reaction was mild irritation. My second, about an hour later, was that the widget had accidentally told the truth. On these instruments, most of what that needle summarises is meaningless anyway. TradingView just declined to pretend otherwise.
I've spent the last few days working out which indicators actually mean something on Derived indices, and which ones are decorative. This is what I found.
What you're actually looking at
Before the indicators, the instruments. This matters because every indicator makes assumptions about the price series it's measuring, and Derived indices break most of them.
A Volatility index is a random walk with a fixed volatility target. Volatility 100 targets 100% annualised volatility; Volatility 10 targets 10%. There is no drift built in. There are no trading sessions, no opening bell, no weekend gap, no news. It ticks every two seconds (or every second for the "1s" variants), 24 hours a day, and the only thing that ever happens to the price is the next random step.
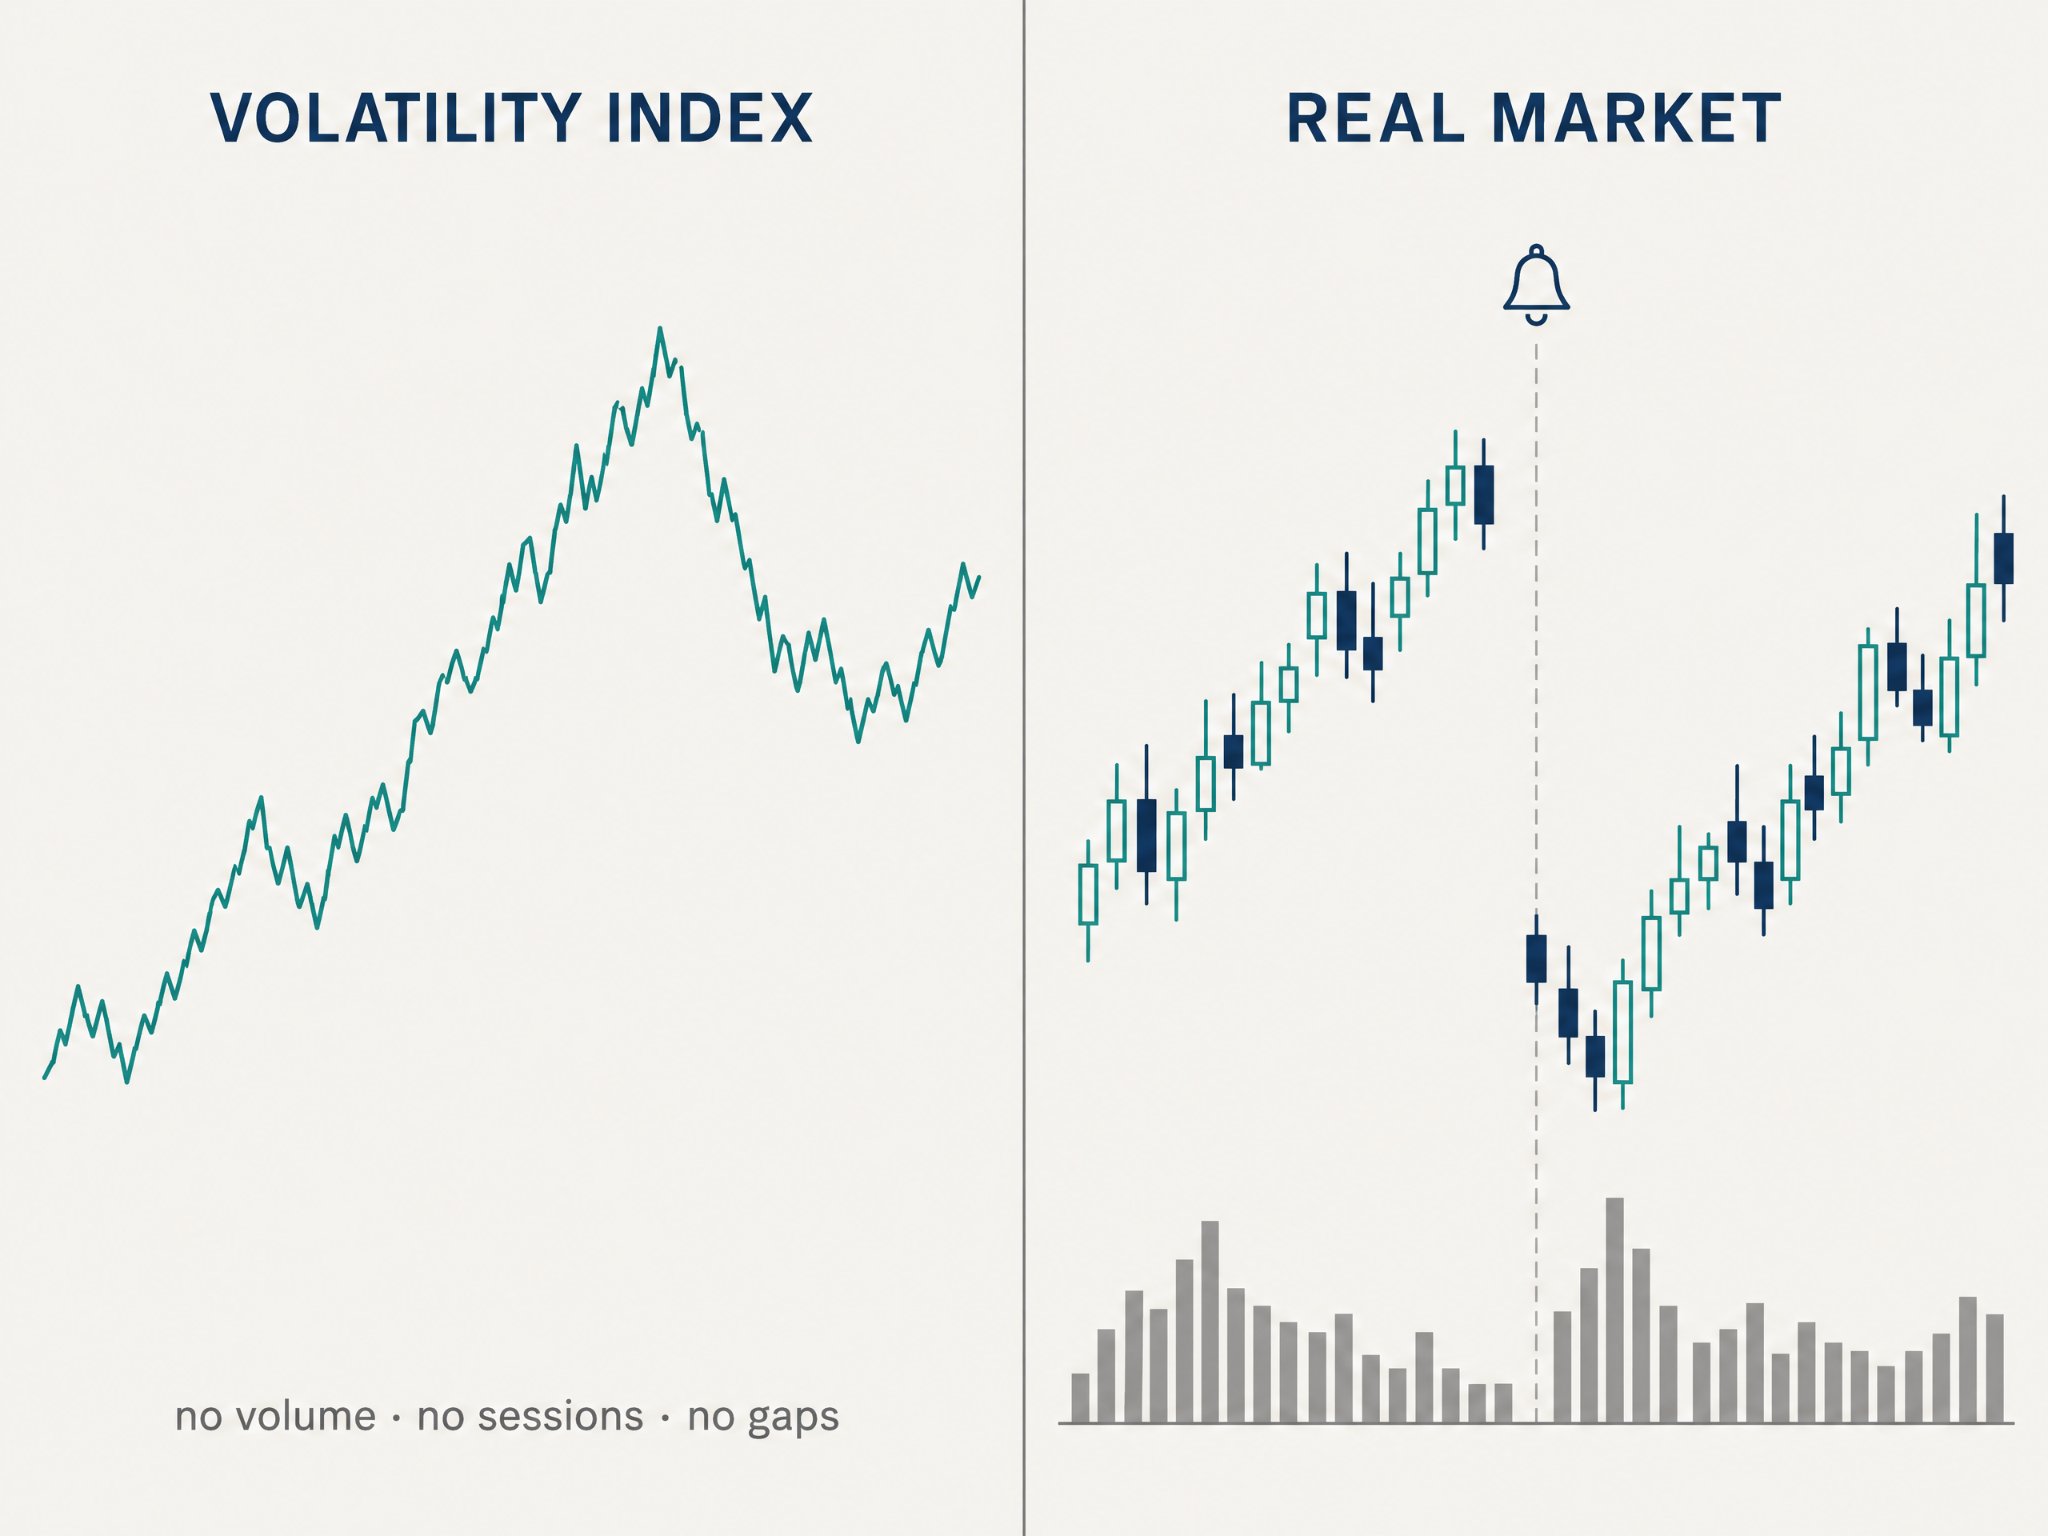
That sounds like a limitation. For someone learning technical analysis, it's closer to a laboratory. Every pattern you see on a Volatility index is pure price behaviour, with nothing else mixed in.
The indicators that have nothing to measure
Here is where the sad cloud starts to look reasonable.
- Anything based on volume. On Balance Volume, Volume-Weighted Average Price (VWAP), Money Flow Index, Chaikin Money Flow, Volume Profile, Accumulation/Distribution. There is no volume. A Volatility index is not an order book; it is a number that updates. What the chart shows as "volume", if it shows anything, is a count of ticks, and the tick rate is constant by design. Every one of these indicators is reading a flat line and drawing conclusions from it.
- Anything based on sessions. Opening range, daily pivot points, session VWAP, market profile. The instrument has no sessions. The daily candle boundary sits at midnight Coordinated Universal Time (UTC) because TradingView has to put it somewhere, not because anything happens at midnight UTC.
- Anything based on gaps, on Volatility and Step indices specifically. Gap fill strategies, gap indicators. These two families never gap: they never close, and every tick is a small step from the last one. I want to be precise here, because it is not true of the whole Derived range. Boom, Crash, Jump and DEX indices are built around discontinuities. A Crash 1000 drop is, quite literally, a designed gap down, arriving on average once every thousand ticks. That is a different problem, and it is next week's piece.
- Anything fundamental or seasonal. No earnings, no dividends, no underlying company, no "sell in May". The instrument has nothing outside itself.
None of this is a fault in the indicators. They're built for markets made of people. Derived indices are made of arithmetic.
The indicators that compute but don't mean what you think
This is the more interesting group, because these still produce numbers.
Trend-following tools: Moving Average Convergence Divergence (MACD), Ichimoku, Average Directional Index (ADX), moving-average crossovers. All of them calculate fine on a Volatility index. All of them will generate crossovers and signals. And on a series with zero drift, every one of those signals is describing the past, not the future. The moving averages crossed because the random walk happened to wander in one direction for a while. It carries no information about the next step. I'm not saying this as a general scepticism about trend following; I'm saying it about a series that is mathematically defined to have no trend. Watching MACD fire confidently on Volatility 10 is genuinely educational about what MACD measures. It is not a trading signal.
ATR. Average True Range on a constant-volatility instrument is, unsurprisingly, close to a flat line. It's not useless: it's the clearest visual proof of what the instrument is. But if you're using ATR to detect "volatility expansion" as a setup, there is nothing to detect.
The ones that earn their place
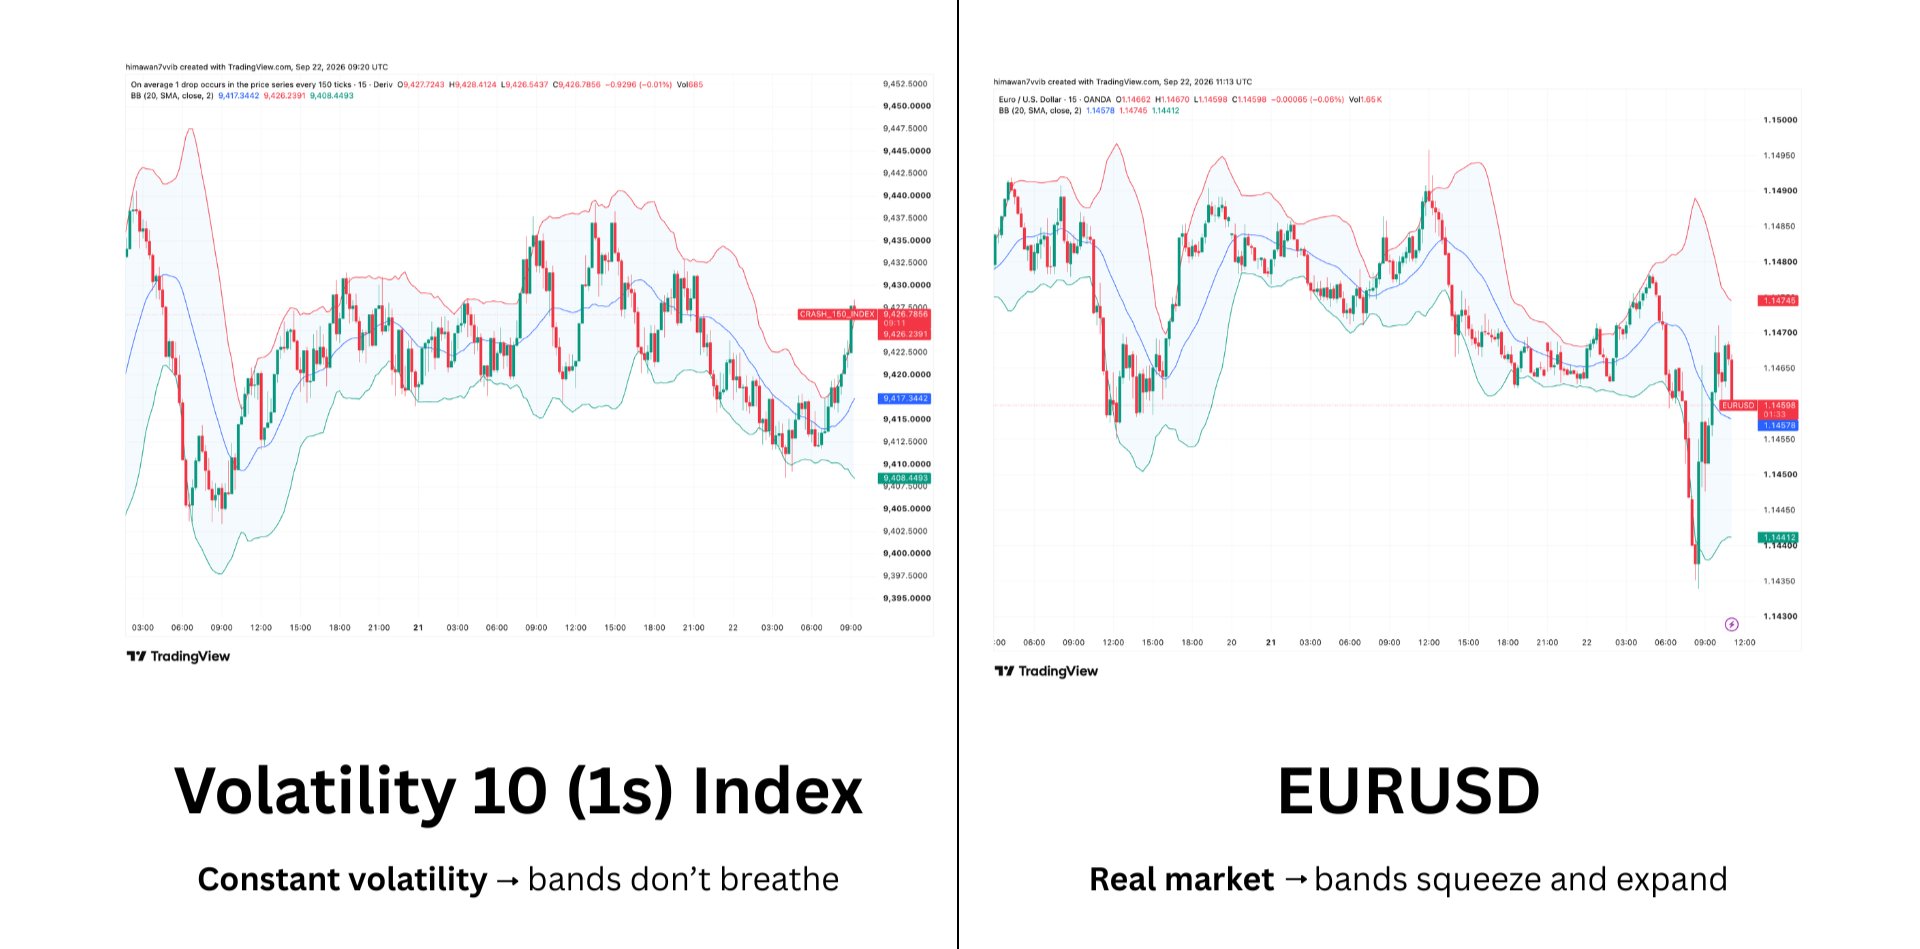
Bollinger Bands. This is the one I'd put on every Volatility index chart. Because the volatility is constant, the band width barely changes across the chart. On a stock, Bollinger Bands breathe: they squeeze before news and expand after. Here they hold their width like a corridor. Touches of the upper and lower bands are a clean illustration of mean reversion, without any of the confounding events that make the same lesson murky on real markets.
Disclaimer: The performance figures quoted refer to the past, and past performance is not a guarantee of future performance or a reliable guide to future performance.
Relative Strength Index (RSI) and Stochastic. Both apply. On a driftless series RSI oscillates around 50 and visits 30 and 70 regularly, for no reason other than the random walk wandering. That's the lesson: overbought and oversold are statements about recent movement, not about value. On these instruments there is no value to be over or under.
Moving averages as a reference line. Fine as smoothing. Not as a system.
What I'd tell someone starting out
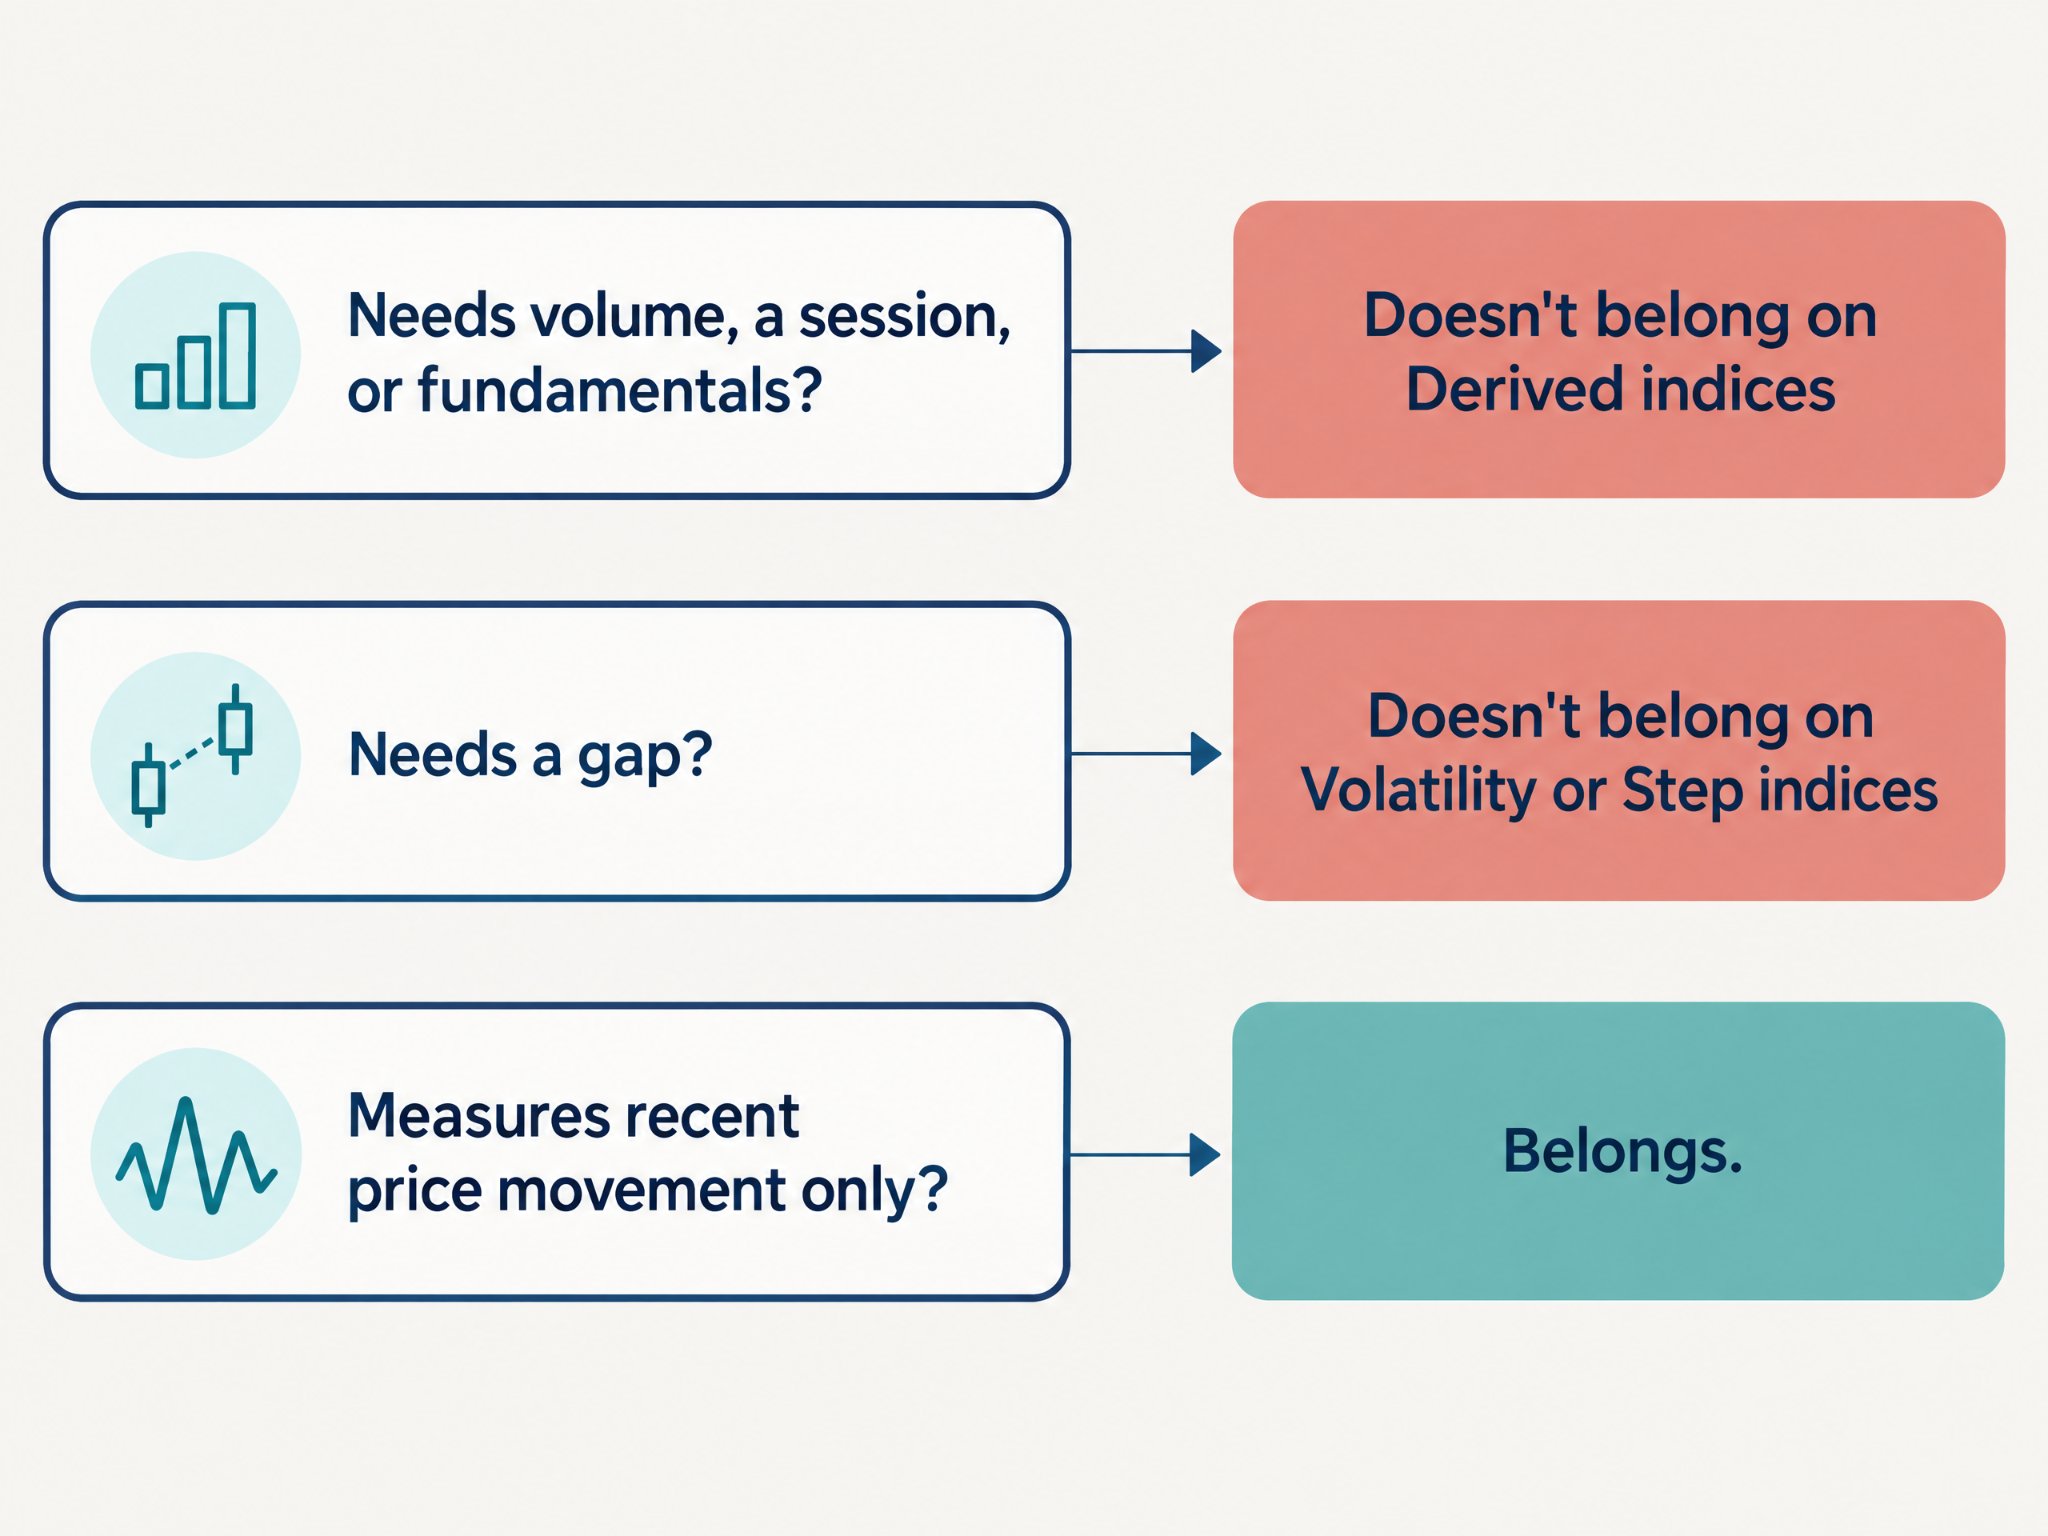
If an indicator needs volume, a session or a fundamental, it does not belong on any Derived index. If it needs a gap, it does not belong on a Volatility or Step index. If it measures recent price movement, it does. That rule covers about ninety percent of the indicator menu, and the sad cloud was TradingView applying the same rule from the other direction.
One more thing a hadn't expected. Because so much of the menu is inert here, a Volatility index is a surprisingly good place to learn what the remaining indicators actually do. Strip out the news, the sessions and the volume, and what's left is the maths. If you've ever wondered what RSI is measuring when it says 70, watch it on Volatility 10 for an hour. It will tell you. Next week: Boom and Crash indices, where the instrument itself has a built-in drift and a designed gap arriving at random, and where almost every verdict in this piece flips.
This content is not intended for EU residents.