What Moving Averages Tell You About Who Controls a Market
When an index gaps below its key moving averages, sellers take short-term control until buyers reclaim them. How to read the level, with S&P 500 examples.
By the Deriv desk · 24 June 2026 · 4 min read

When an index gaps below the moving averages that recently held it up, short-term control has flipped to sellers until buyers reclaim those levels. That is the read after U.S. equities gapped lower, dropping the S&P 500 and Nasdaq back under their 100-hour and 200-hour averages.
How a moving average acts as a line in the sand
A moving average is just the average price over a recent window, redrawn each bar. Traders watch it because price tends to respect it. Above it, buyers have the edge. Below it, sellers do.
The side of the average price sits on tells you who currently holds the advantage. You do not need a view on the economy to read it. You read the chart.
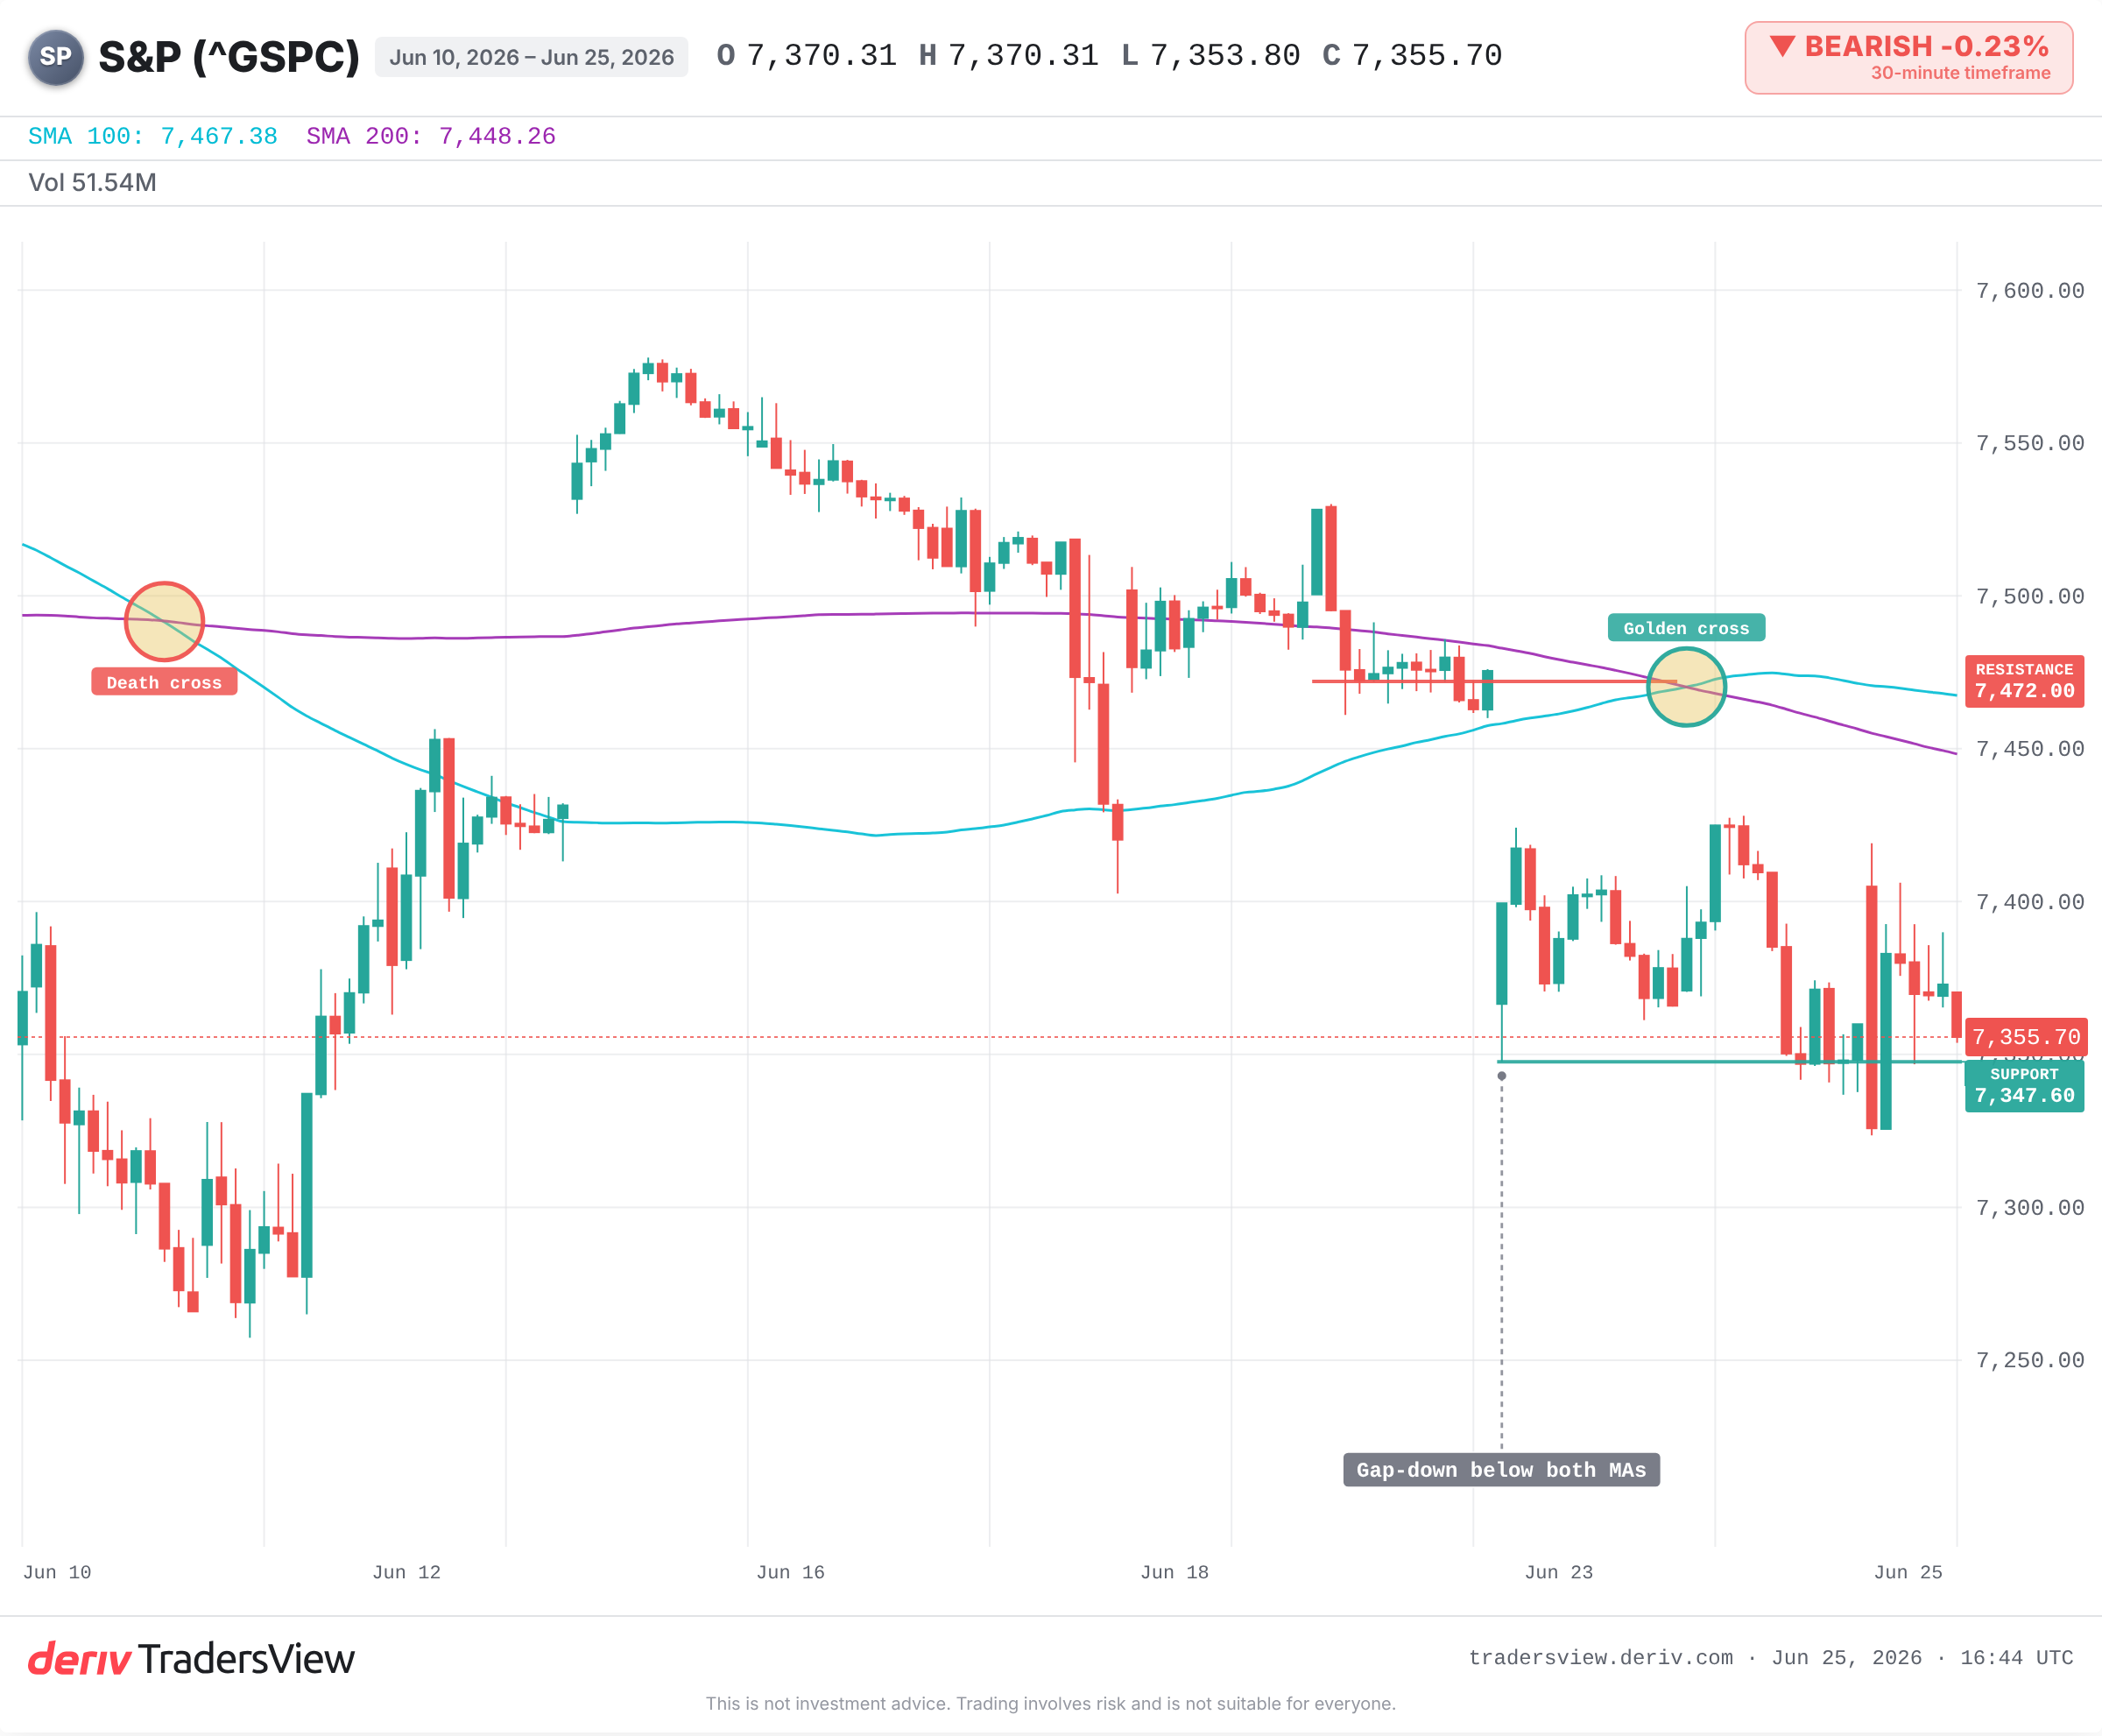
This week the S&P 500 and Nasdaq both gapped below their 100-hour and 200-hour averages. Short-term momentum handed the wheel to sellers.
Why reclaiming the average matters more than the size of the drop
The drop itself is not the verdict. What matters is whether buyers can climb back above the levels they lost.
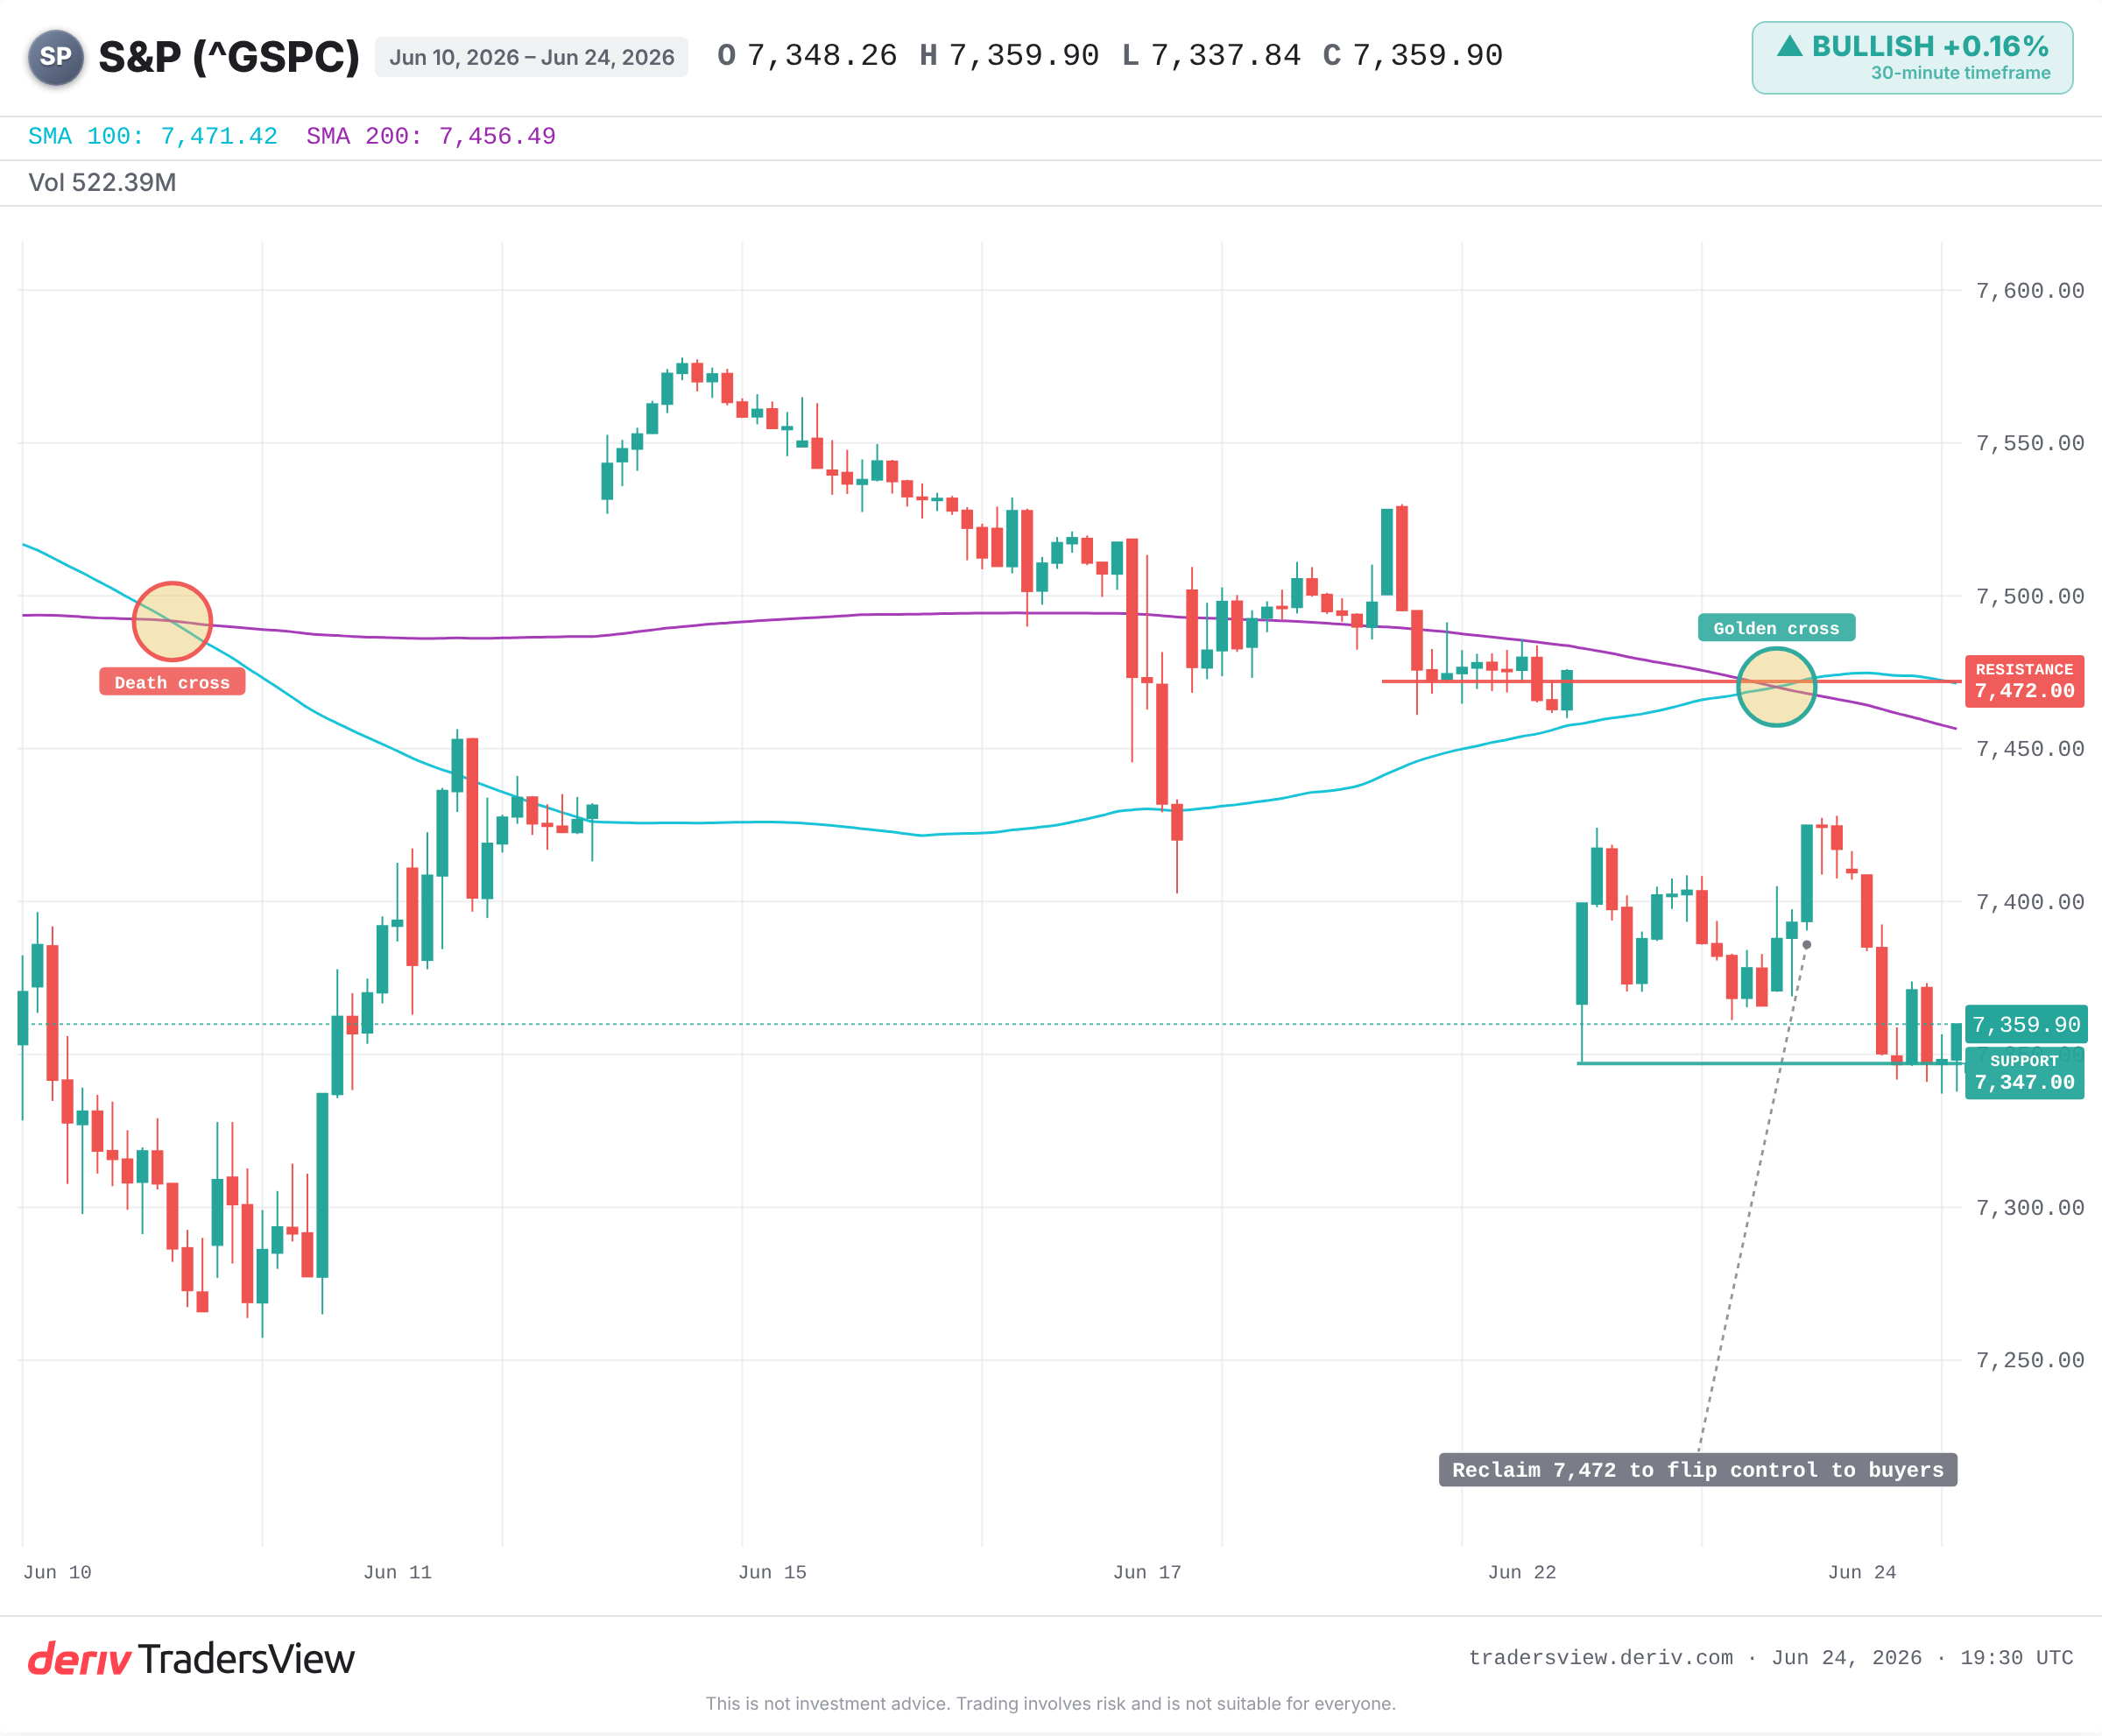
On the S&P 500, the 100-hour and 200-hour averages have converged into one resistance band near 7,472. That is the line. Below it, the bearish short-term read stands. A close back above it, on stronger breadth, flips the story.
The level to reclaim, not the depth of the gap, is what decides near-term control.
The case this is a shakeout, not a regime change
The same session that broke the averages also showed buyers fighting back. The S&P 500 fell to around 7,347, then rebounded toward 7,421. As of the latest read it trades near 7,424, already pressing back toward that 7,472 band.
That is not the picture of sellers in full command. It looks more like a flush than a trend change.
August 2024 rhymes here. A sharp risk-off gap drove the S&P below its short-term averages in days. The index reclaimed them within weeks and made new highs by September. Loss of short-term control is often a pause when the longer-term trend stays intact.
When the same break runs much further
The opposite can happen. Late 2018 is the warning. The S&P broke its 200-day average as rate and growth fears built, and short-term momentum flipped to sellers.
That break did not bounce. It extended into a near-20% drawdown by December before a sharp recovery in 2019.
The difference is what sits behind the break: a clean intraday gap tends to mend, a break tied to real macro deterioration can run. Higher rates, slower global growth, and any pullback in AI-related capital spending are the catalysts cited this time.
What to watch from here
- A daily close back above the ~7,472 converged averages on broad breadth would flip control to buyers.
- Rejection at that band keeps sellers in charge.
- A break and hold below the swing support near ~7,347 opens further downside.
- A rising VIX and a rebound carried by only a few mega-caps would warn the selling is broadening.
The indicator is simple and repeatable. Read which side of the averages price sits on, then watch whether the lost level is reclaimed. That tells you who is in control, this week and the next time it happens.
Frequently asked questions
Both average the closing price over a recent window, the 100-hour over the last 100 hourly bars and the 200-hour over 200. The shorter average reacts faster to price; when the two converge, they form a single, stronger level traders watch.
Not on its own. A gap lower reflects short-term selling pressure and can mend quickly, as in August 2024. It signals a recession risk only when it pairs with genuine macro deterioration, as the late-2018 break did.
Watch whether price reclaims the level. A break that quickly recovers back above the average, ideally on a daily close and broad breadth, tends to be a shakeout. A break that holds below and extends is more likely a genuine momentum shift.
Hourly averages track short-term momentum and intraday control, useful for active traders. Daily averages like the 200-day map the longer-term trend. Many traders watch both, since a short-term break matters more when it lines up with the bigger trend.